Daily insight into revenue, order intake and order book
Up to date every morning, in one overview everyone trusts.
The same numbers for everyone, every morning
Works with existing Excel exports and databases
We connect to your data in SharePoint/OneDrive or a database. The result: reliable reports.
Works with existing Excel exports and databases
We connect to your data in SharePoint/OneDrive or a database. The result: reliable reports.
Fresh figures every morning
Daily refresh; the overview is ready by 9:00 AM.
Fresh figures every morning
Daily refresh; the overview is ready by 9:00 AM.
No IT project needed
We build and publish the report, ready to use.
No IT project needed
We build and publish the report, ready to use.

How it works
1. Intake
We align goals and definitions together.
2. Retrieve data
Once access to the data is arranged, we take care of the rest.
3. Going live
Within a few weeks the report is online.
4. Revision
After go-live, we process your feedback in the revision round(s) included in your package.
Focus on the signal, not the noise
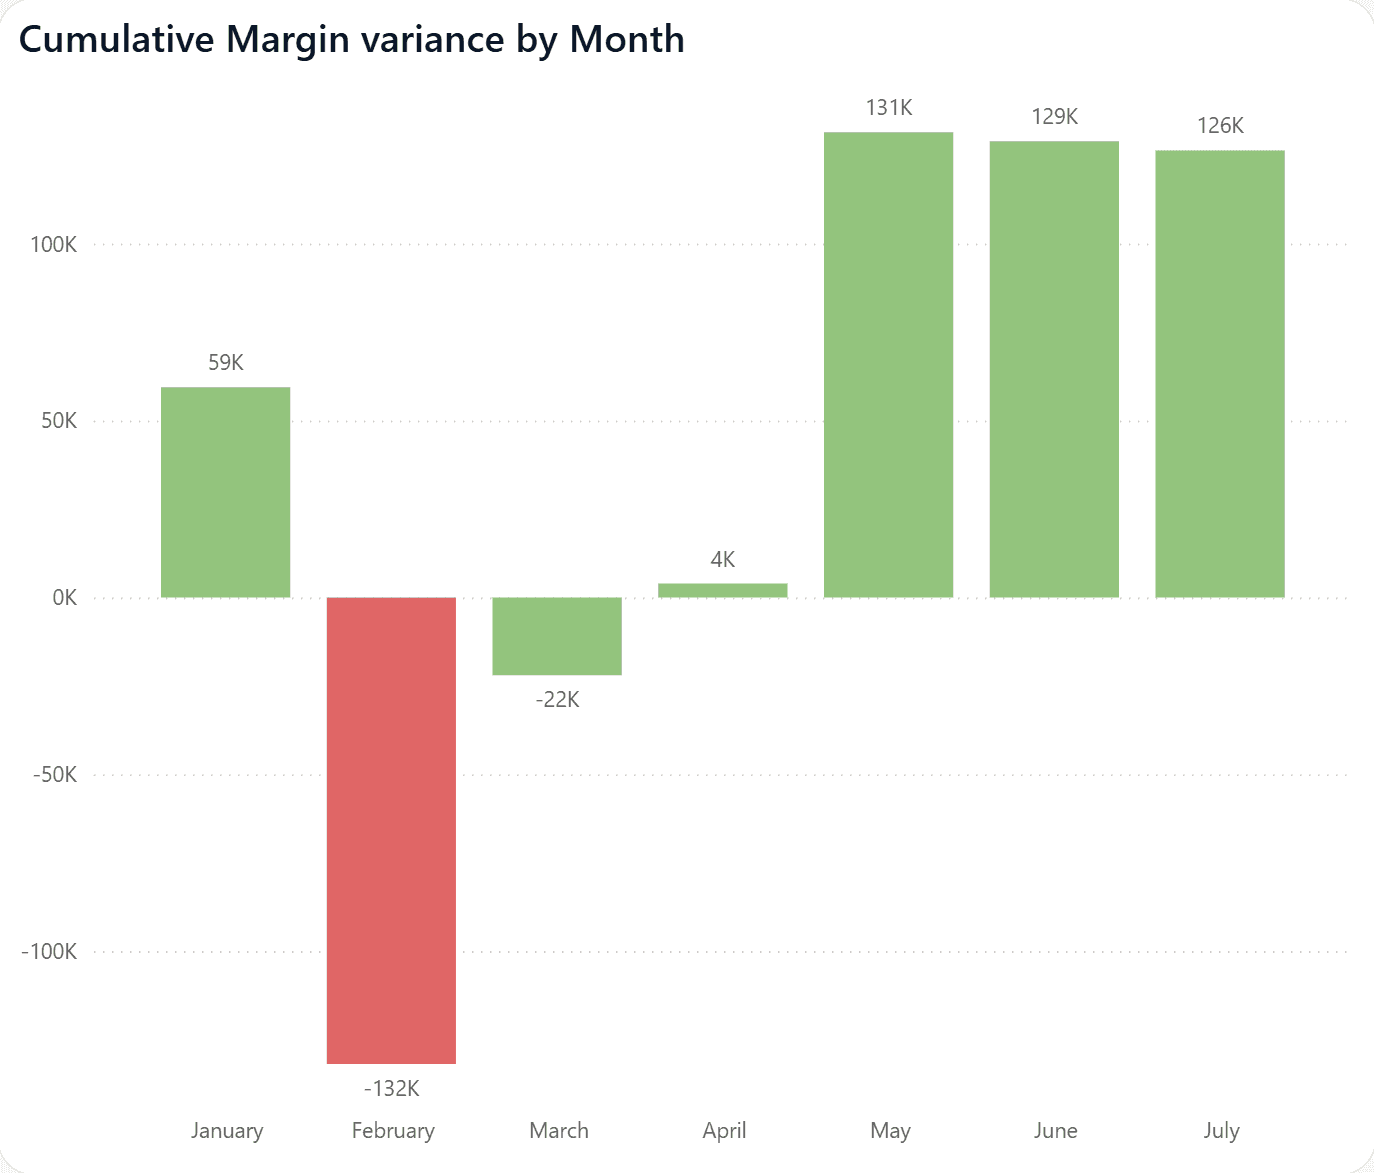
Overview
The key figures on one screen.
Revenue: WTD, MTD, YTD
Order intake: MTD, YTD vs. previous year
Order book: what's coming in
Book-to-Bill: intake vs. revenue
Largest deviations: per customer and product
Overview
The key figures on one screen.
Revenue: WTD, MTD, YTD
Order intake: MTD, YTD vs. previous year
Order book: what's coming in
Book-to-Bill: intake vs. revenue
Largest deviations: per customer and product
Overview
The key figures on one screen.
Revenue: WTD, MTD, YTD
Order intake: MTD, YTD vs. previous year
Order book: what's coming in
Book-to-Bill: intake vs. revenue
Largest deviations: per customer and product
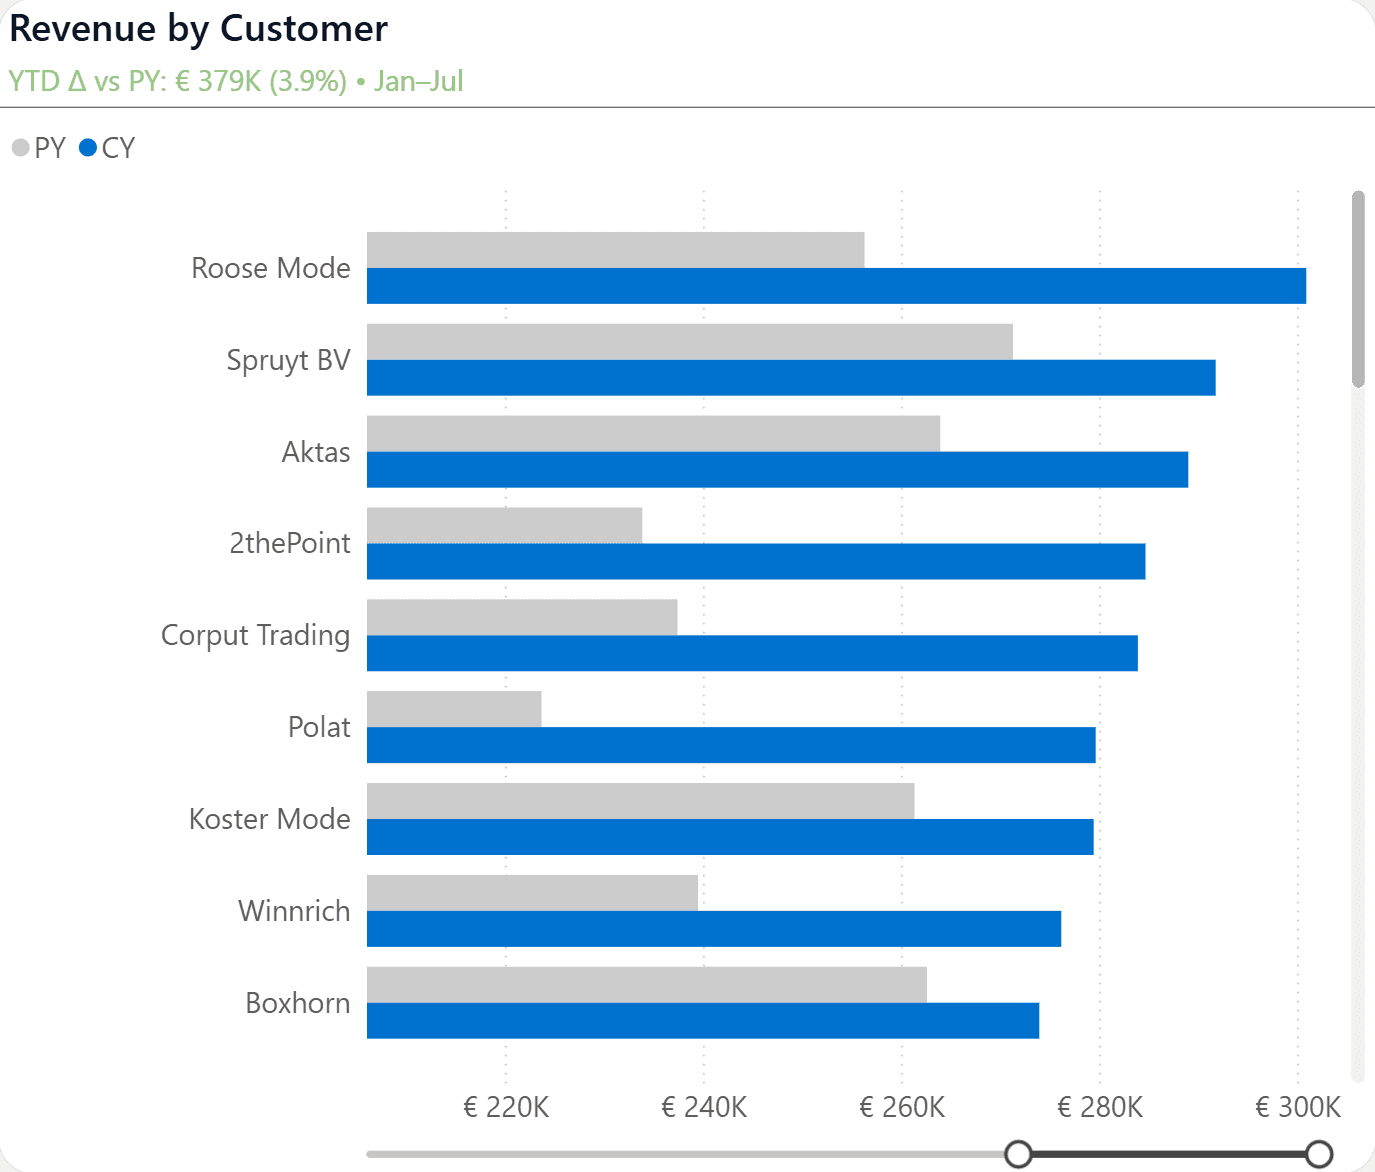
Operations
Where the figures come from: per customer, product and region.
Drivers per customer and product: growth or decline
Regions and segments: clear breakdown
Outstanding orders: where the work is
Age of open orders: how long they've been open
Operations
Where the figures come from: per customer, product and region.
Drivers per customer and product: growth or decline
Regions and segments: clear breakdown
Outstanding orders: where the work is
Age of open orders: how long they've been open
Operations
Where the figures come from: per customer, product and region.
Drivers per customer and product: growth or decline
Regions and segments: clear breakdown
Outstanding orders: where the work is
Age of open orders: how long they've been open
Why it works
One overview that everyone trusts
Consistent definitions, totals that align 1-to-1 and daily refresh.
Two packages, fixed starting price
Lean
From
€7,900
Connects 1 source (Excel/SharePoint/SQL)
3 pages in total
Overview of revenue, order intake & order book
Automatic daily refresh
Simple trends and comparisons
1 revision round after delivery
Most popular
Standard
From
€12,900
Everything in Lean, plus:
Connects up to 2 sources
Up to 5 pages in total
Extra breakdown page (customer/product/region)
More detailed trend analysis
2 revision rounds for fine-tuning
More than two sources or other requirements? See Projects.
Proven & practical
Live within weeks
Simple setup and fast go-live.
Live within weeks
Simple setup and fast go-live.
For sales and operations
Fixed reports for revenue, order intake and order book.
For sales and operations
Fixed reports for revenue, order intake and order book.
Up-to-date
One reliable overview, every morning.
Up-to-date
One reliable overview, every morning.
10+ years of BI experience
Reporting for mid-sized companies
10+ years of BI experience
Reporting for mid-sized companies
These customers chose Novarix
Novarix helped us build a comprehensive PowerBI solution. Their work in doing so has been outstanding. They quickly understood the complex data landscape we have as a manufacturing company, and translated it into simple, yet very helpful visualizations. As a result, we significantly improved our ability to make data-driven decisions in all areas. In short, I can more than recommend them.

Lukas Himmel
Chief Strategy Officer (CSO) vandaglas Group | Associate Director at AEQUITA Private Equity
Novarix helped us build a comprehensive PowerBI solution. Their work in doing so has been outstanding. They quickly understood the complex data landscape we have as a manufacturing company, and translated it into simple, yet very helpful visualizations. As a result, we significantly improved our ability to make data-driven decisions in all areas. In short, I can more than recommend them.
Lukas Himmel
Chief Strategy Officer (CSO) vandaglas Group | Associate Director at AEQUITA Private Equity
Robbert quickly masters new subjects and listens carefully to his clients' needs. With his eye for data, he draws sharp conclusions and presents them clearly. His commercial knowledge helps enormously.

Awara Pshdary Treur
Commercial Director ZZA - Zorgadministratie & Applicatiebeheer
Robbert quickly masters new subjects and listens carefully to his clients' needs. With his eye for data, he draws sharp conclusions and presents them clearly. His commercial knowledge helps enormously.
Awara Pshdary Treur
Commercial Director ZZA - Zorgadministratie & Applicatiebeheer
Robbert quickly masters new subjects and listens carefully to his clients' needs. With his eye for data, he draws sharp conclusions and presents them clearly. His commercial knowledge helps enormously.
Awara Pshdary Treur
Commercial Director ZZA - Zorgadministratie & Applicatiebeheer
Novarix helped develop key Power BI reports for our entities Ziegler, Eckelt and Kreuzlingen. They translated complex data into clear sales, production and pricing reports, and collaborated effectively with both local teams and management. The structured approach and strong communication made the project a success. Highly recommended.

Christian Lechner
Managing Partner at AVITAS & IQVESTA
Novarix helped develop key Power BI reports for our entities Ziegler, Eckelt and Kreuzlingen. They translated complex data into clear sales, production and pricing reports, and collaborated effectively with both local teams and management. The structured approach and strong communication made the project a success. Highly recommended.
Christian Lechner
Managing Partner at AVITAS & IQVESTA
Frequently asked questions
Which package is right for us?
Lean fits one central data source and a basic overview of revenue, order intake and order book. Standard fits two sources or an extra breakdown per customer, product or region. More sources or other requirements? Then it's a project.
What if our data isn't in Excel or SQL?
How long does implementation take?
What if we want to expand later?
Is there support after delivery?
Want a dashboard that's ready to go?
See how Novarix transforms your existing data into a reliable overview.
Want a dashboard that's ready to go?
See how Novarix transforms your existing data into a reliable overview.
Want a dashboard that's ready to go?
See how Novarix transforms your existing data into a reliable overview.